Glasgow’s uk/local/west-end/">West End sees rents rise faster than the Southside due to higher demand from students and professionals. The University of Glasgow drives this demand. Proximity to amenities and cultural sites adds pressure. Southside faces lower demand from fewer institutions and slower development.
- What Defines Glasgow’s West End and Southside?
- What Causes Higher Demand in the West End?
- How Do Amenities Impact West End Rent Growth?
- Why Is the West End Supply Tighter Than Southside?
- What Do Rent Price Data Show for Both Areas?
- What Role Do Students Play in West End Rent Spikes?
- How Does Economic Investment Differ Between Areas?
- What Are the Implications for Tenants and Investors?
- How Might Future Trends Affect the Rent Gap?
What Defines Glasgow’s West End and Southside?
Glasgow’s West End covers postcodes G11 and G12, including Hyndland, Hillhead, Partick, and Dowanhill. The Southside spans G41 and G42, including areas near Queen’s Park like Shawlands and Pollokshields. West End rents average £1,100 monthly for one-beds, 25% above city norms; Southside averages £850.
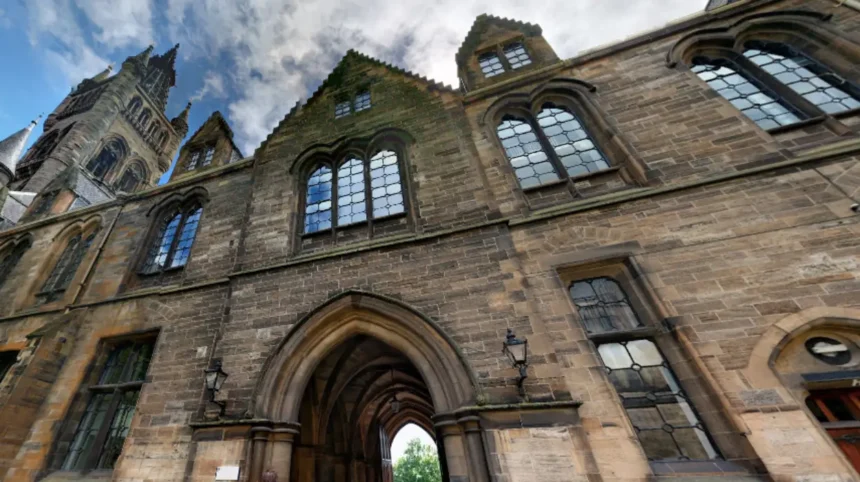
The West End features Victorian tenements and green spaces like Kelvingrove Park. Kelvingrove Park spans 85 acres and hosts events drawing 1 million visitors yearly. The University of Glasgow, founded in 1451, enrolls 35,000 students in this zone. These elements create a dense residential core.
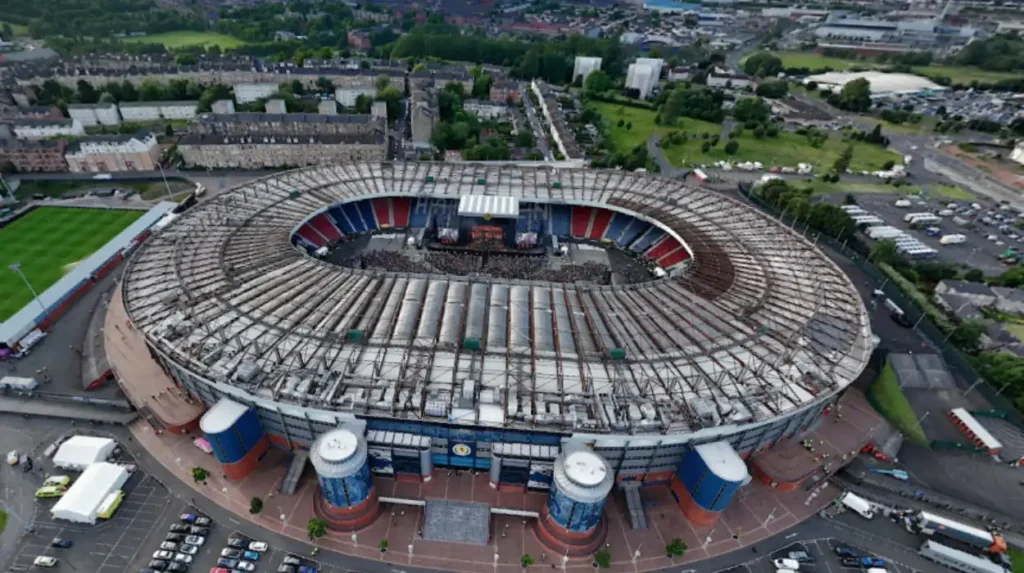
Southside includes larger tenements and detached homes near Hampden Park stadium. Hampden Park seats 52,000 for football matches. The area links to shipbuilding history from the 19th century. Population density stands at 5,000 per square kilometer, lower than West End’s 8,000.
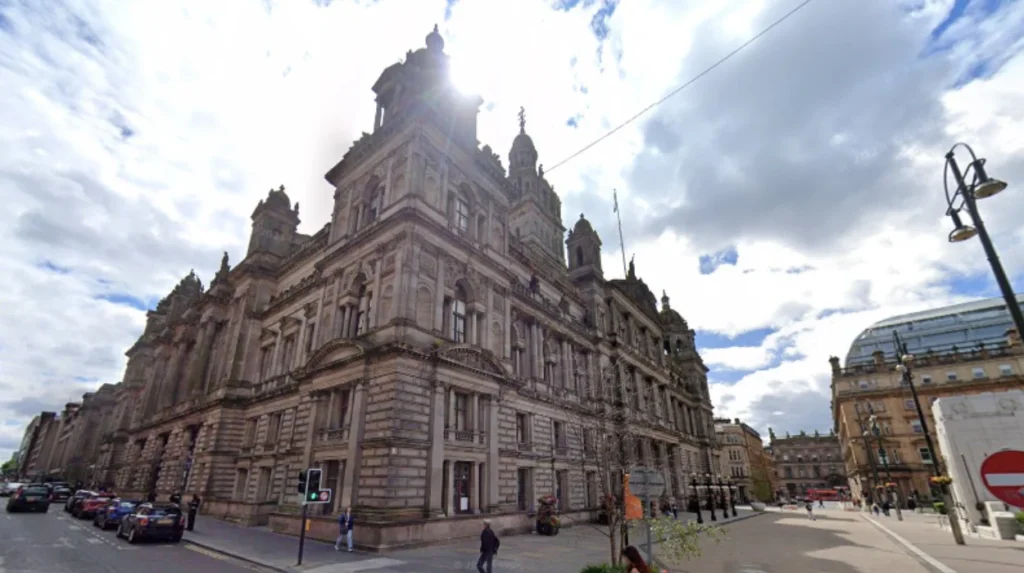
Historical boundaries stem from 19th-century urban planning. West End developed as an elite suburb post-1800. Southside grew via industrial workers in the 1850s. Current rent gaps widened after 2014 Commonwealth Games boosted Southside investment by £1.1 billion, yet West End outpaced it.
Implications include tenant shifts. West End attracts high earners; Southside serves families. Future zoning may balance growth.
What Causes Higher Demand in the West End?
University of Glasgow generates 35,000 student renters yearly, pushing West End occupancy to 95%. Professionals seek amenities like cafes and subway links, shortening vacancies to 21 days. Southside lacks comparable institutions, with demand 30% lower.
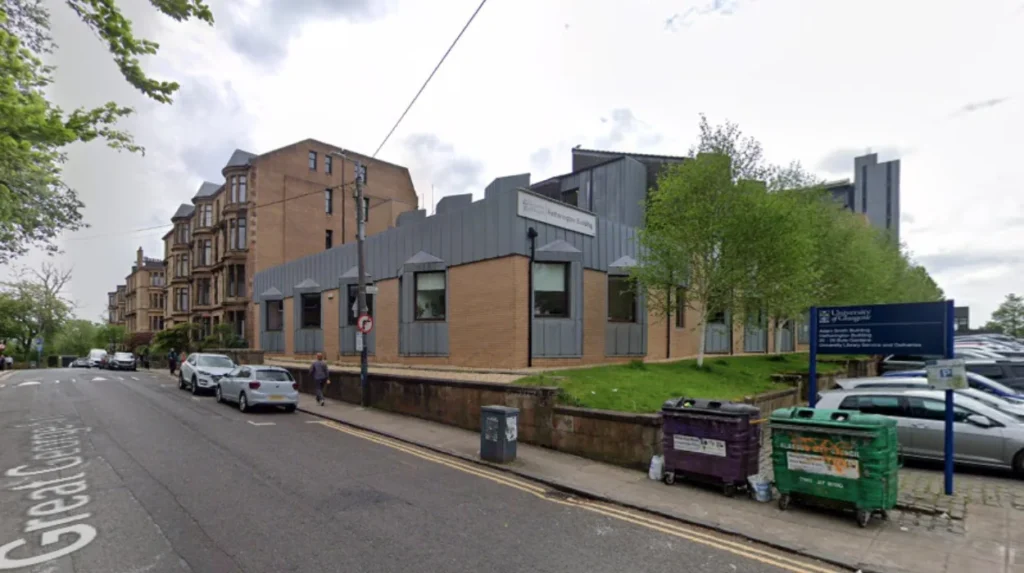
Student influx defines the primary driver. The university’s Gilmorehill campus houses 40% of undergraduates nearby. Postgraduate programs grew 15% from 2020 to 2026. Purpose-built student accommodation added 5,000 beds since 2020, yet spillover fills private lets.
Professional demand follows. Tech firms in Finnieston, adjacent to West End, employ 10,000. Subway stations at Hillhead and Kelvinbridge serve 2 million riders annually. Cycle paths connect to city center in 10 minutes.
Mechanisms operate via supply constraints. Planning restrictions limit new builds to 500 units yearly in G12. Tenement conversions preserve 70% of stock. Land values hit £5,000 per square meter.
Southside contrasts with Queen’s Park attracting families, not students. Regeneration added 2,000 homes post-2014, but uptake lags at 80% occupancy. Implications raise affordability barriers; West End one-beds cost 35% of median income (£28,000).
How Do Amenities Impact West End Rent Growth?
Kelvingrove Art Gallery and 72 cafes within 1km draw 2 million visitors yearly, boosting footfall 40% above Southside. Independent shops in Ashton Lane generate £50 million economic activity. These raise perceived value by 20%, lifting rents £200 monthly.
Cultural sites anchor appeal. Kelvingrove Art Gallery, opened 1901, displays 8,000 artifacts. Botanic Gardens cover 42 acres, hosting festivals for 100,000 attendees. These sites increase dwell time, signaling lifestyle premium.
Retail and dining clusters amplify effects. Byres Road hosts 150 outlets, including 50 eateries. Footfall data shows 1.5 million monthly visitors. Subway integration cuts commute times to 5 minutes citywide.
Processes link amenities to pricing. Agents report 25% premiums for properties within 500m of parks. Airbnb restrictions since 2022 redirected short-term demand to long lets, adding 10% pressure.
Southside offers Shawlands shops and Hampden, but volumes lag: 50 cafes serve 500,000 visitors. Implications favor West End investors; yields hit 6.5% versus Southside’s 5.6%.
Why Is the West End Supply Tighter Than Southside?
West End builds 400 units yearly against 10,000 demand; Southside adds 1,200. Victorian tenements restrict conversions to 20% of stock. Green belt policies cap G12 expansion at 2% land use.
Construction limits define scarcity. Glasgow City Council approved 1,800 West End homes from 2020-2025, averaging 360 annually. Student housing filled 90%, leaving few for general lets. Brownfield sites exhausted post-2010.
Tenement preservation enforces rules. 80% of G11/G12 buildings predate 1914; heritage status blocks 60% of demolition bids. Retrofit costs £300 per square foot, deterring developers.
Southside benefits from Shawlands regeneration: 3,000 units since 2015. Vacant industrial land allows 5% annual growth. Queen’s Park redevelopment added 800 family homes.
Mechanisms include council taxes favoring preservation. West End rates average £1,800 yearly, funding upkeep. Implications strain renters; voids last 18 days versus Southside’s 35.
What Do Rent Price Data Show for Both Areas?
West End one-beds averaged £925 in 2026, up 14% from 2024; two-beds hit £1,400. Southside one-beds stood at £750, rising 8%. G12 premiums reached £4,800 per square meter.
Historical trends confirm divergence. West End rents grew 25% from 2020-2026; Southside 12%. Hyndland led at £1,200 monthly averages. Rightmove data logs £252,000 sale prices, up 2% yearly.
Current snapshots reveal gaps. Investropa reports West End 20-30% above city £925 norm. Hillhead two-beds list £1,500; Partick £1,300. Southside G41 averages £850, with Pollokshields at £900.
Comparisons use ONS indices. West End private rents index rose 18 points 2022-2026; Southside 9 points. Yields: West End 6.46%, Southside 5.63%.
Forecasts predict 3.5% West End growth in 2027. Data sources include Zoopla (10,000 listings) and council reports. Implications guide budgeting; West End claims 40% income share.
What Role Do Students Play in West End Rent Spikes?
35,000 University of Glasgow students occupy 60% of West End lets. Enrolment rose 10% post-pandemic, filling 5,000 new beds. Private market absorbs 70% overflow, hiking rents 15% yearly.
Enrolment drives volume. Main campus in Hillhead serves 11,000 postgrads. International students, 30% of total, prefer tenements costing £700-£900. September influx cuts availability 50%.
Accommodation processes allocate supply. University guarantees 4,000 beds; private firms like Unite added 2,000. HMO licenses cap 20,000 rooms, yet demand exceeds by 5,000.
Examples include Hyndland HMOs renting £550 per bedspace. Dowanhill saw 20% rises post-2023 visa surges. Southside student share sits at 15%, near Strathclyde.
Implications include seasonal peaks: August voids drop to 5%. Policy caps like 2020 rent controls eased 5%, but lapsed.
How Does Economic Investment Differ Between Areas?
West End drew £200 million private funds 2020-2026 for tech and culture; Southside £150 million post-Commonwealth. Finnieston’s BBC Scotland base employs 1,000, spilling demand.
Investment channels target West End. Clyde Gateway injected £500 million citywide, 40% to G3/G12. Pacific Quay media quarter hosts 2,000 jobs.
Southside focuses regeneration. Queen’s Park added £100 million housing; Hampden upgrades cost £50 million. Shipbuilding legacy employs 3,000.
Mechanisms favor West End via grants. Scottish Enterprise funds 20% of G12 projects. Returns show 7.1% house price growth versus Scotland 4.6%.
Examples: Partick’s £20 million retail park; Shawlands’ £30 million homes. Implications boost West End yields to 6.5%.
What Are the Implications for Tenants and Investors?
Tenants face 35% income allocation in West End versus 28% Southside. Investors gain 6.46% yields in G12, 15% capital growth. Affordability caps force Southside migration.
Tenant burdens escalate. Median rent-to-income hits 38% in Hillhead; evictions rose 12% 2025. Sharing rises: 40% under-30s in HMOs.
Investor math favors West End. £250,000 two-beds yield £18,000 annually. Appreciation hit 20% past five years in G12/G11.
Southside offers entry: £185,000 averages, 5.63% yields. Policy risks include 2026 rent stabilization proposals.
Future sees 3% citywide growth; West End leads at 4%. Mitigation: council housing added 1,000 units.
How Might Future Trends Affect the Rent Gap?
West End growth projects 4% annually to 2030 from 2,000 new jobs; Southside 2.5% via 3,000 homes. Net zero retrofits add £500 million costs, squeezing supply.
Projections use ESPC data. Glasgow rents climb 5% 2026; West End premiums persist via 10,000 students.
Infrastructure aids Southside: Crossrail equivalent by 2028 cuts commutes 20%. West End subway expansions serve 3 million.
Policy shifts loom. 2025 Scottish bill caps increases at 3%. Green belts hold; 1,500 units planned G41.
Examples: Kelvinside refurbishments at £6,500/sqm; Pollokshields expansions. Gap narrows to 15% by 2030.